


Hope your 2019 is off to a great start! Below you will find a market update report which will provide you with information on the local real estate market and recent sales activity in your specific area. Don’t hesitate to contact us if you have any questions or if you are ready to move forward with the next step!
Kitchener/Waterloo Market Update for January 2019
Market Update
The first month of 2019 has come to an end and this is what’s going on in the Kitchener/Waterloo real estate market.
Sales:
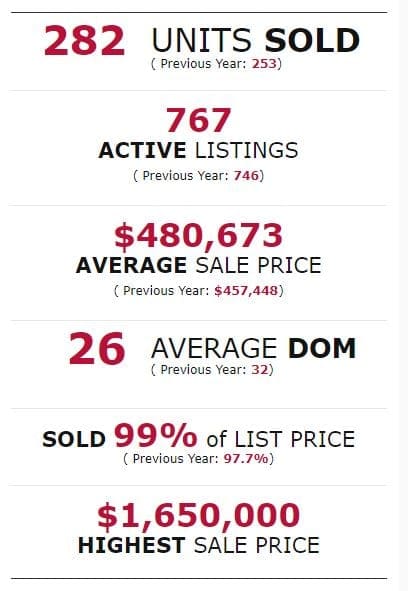
There were 282 sales in January. That’s up 11% from what we had January 2018.
Active Listings:
Then, if we look at the number of active listings, there’s 767. That is up, but only 3% from what we had in 2018. There were 592 new listings that hit the market this January. That’s up 17% from what we had last year.
Average Sale Price:
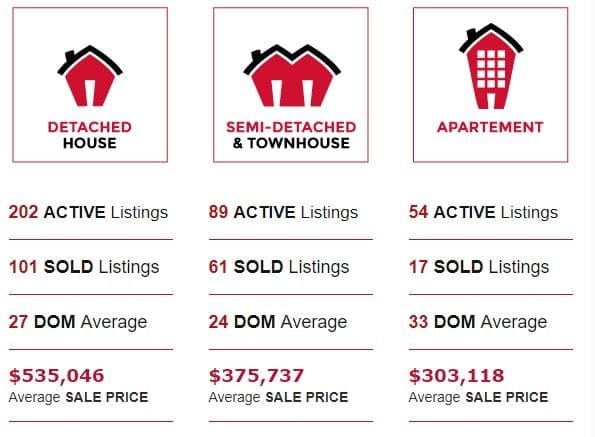
Our average sale price for all housing types in the KW area is up 5% with an average sale price of $480,673. If we dive into more detail:
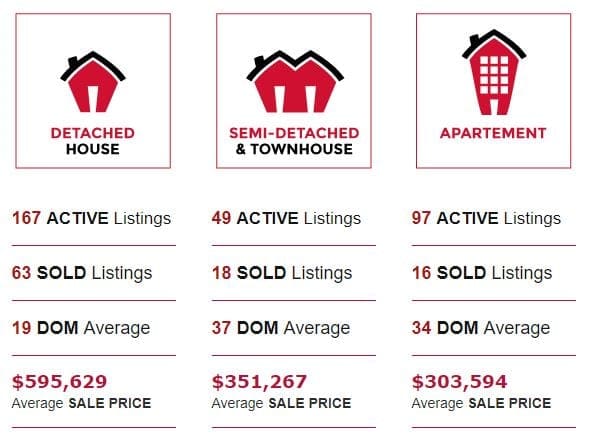
Detached homes: up about 3% with an average sale price of $558,319.
Attached houses: up 2% with an average sale price of $362,302
Condo style apartments: up 20% with an average sale price of $303,379.
A good amount of appreciation across all the different housing types.
Sale to List Ratio:
When we look at the houses that are selling, on average they are selllinh for 98.4% of list price. When you’re listing your house in the KW area, you want to build a little bit of room for negotiations. There’s not a ton, especially in the lower price points, but you do want to factor in that 1% to 1.5% for negotiating room. Looking at the houses that are selling, 34.6% of those are actually selling to multiple offers and going above asking price. The majority of these properties (about 90% of them) are listed under that $600,000 price point, meaning it’s a very active market in the lower price points.
Supply & Demand:
We have 2.72 Months of Inventory, which is slightly less than what we had in January of last year. That does put us in a seller’s market overall. Now, diving into a little more detail, when we look at houses under that $600,000 price point, we’ve got to 2 months of inventory. Between$600,000 and a million, we’re sitting around 4-5 months of inventory, meaning it is more of a balanced market. Then, when you go to that million dollar plus, we’re over 20 months of inventory. Definitely a buyer’s market in that higher end price point, which is normal. We usually have buyer’s market in that price point, especially early on in the year.
Summary:
Overall, when we look at how the market did this January, it was really good. Sales are up. Inventory is relatively flat. From a seller’s perspective, it’s been very active. Houses are selling really close to list and that lower price point is extremely active, especially anything around the universities in Waterloo where you’ve got student investors looking to purchase.
If you have any questions about the Kitchener/Waterloo real estate market, please comment below and we’d be happy to answer any questions you have.
Neighborhood Statistics
Kitchener


Click here for Active Listings In This Area
Click here for Solds In This Area
Waterloo

Click here for Active Listings In This Area
Click here for Solds In This Area
If you have any questions about the Kitchener/Waterloo Market Update for January 2019 feel free to contact The GoWylde Team.
If you would like a free online home evaluation click here