


Get the latest updates on home prices, sales activity, mortgage trends, and market shifts, along with active and sold listings in Guelph, Kitchener-Waterloo, and Cambridge. Whether you’re buying, selling, or investing, our expert insights help you navigate the market with confidence.
Jump Sections:
Thinking about your next move in 2026? The GoWylde Vault gives you instant access to affordability tools, neighbourhood insights, seller prep guides, and everything you need to plan confidently.
Guelph, KW & Cambridge Real Estate Update
When looking across the region, Guelph remains the strongest market from a pricing standpoint. Kitchener/Waterloo is experiencing the most significant slowdown, with both sales and prices under pressure. Cambridge appears to be benefiting from affordability, with homes selling faster and sales volumes holding up surprisingly well despite lower prices. Across all three markets, buyers remain active, but they’re more selective, more price-sensitive, and far less willing to overpay than they were a few years ago.
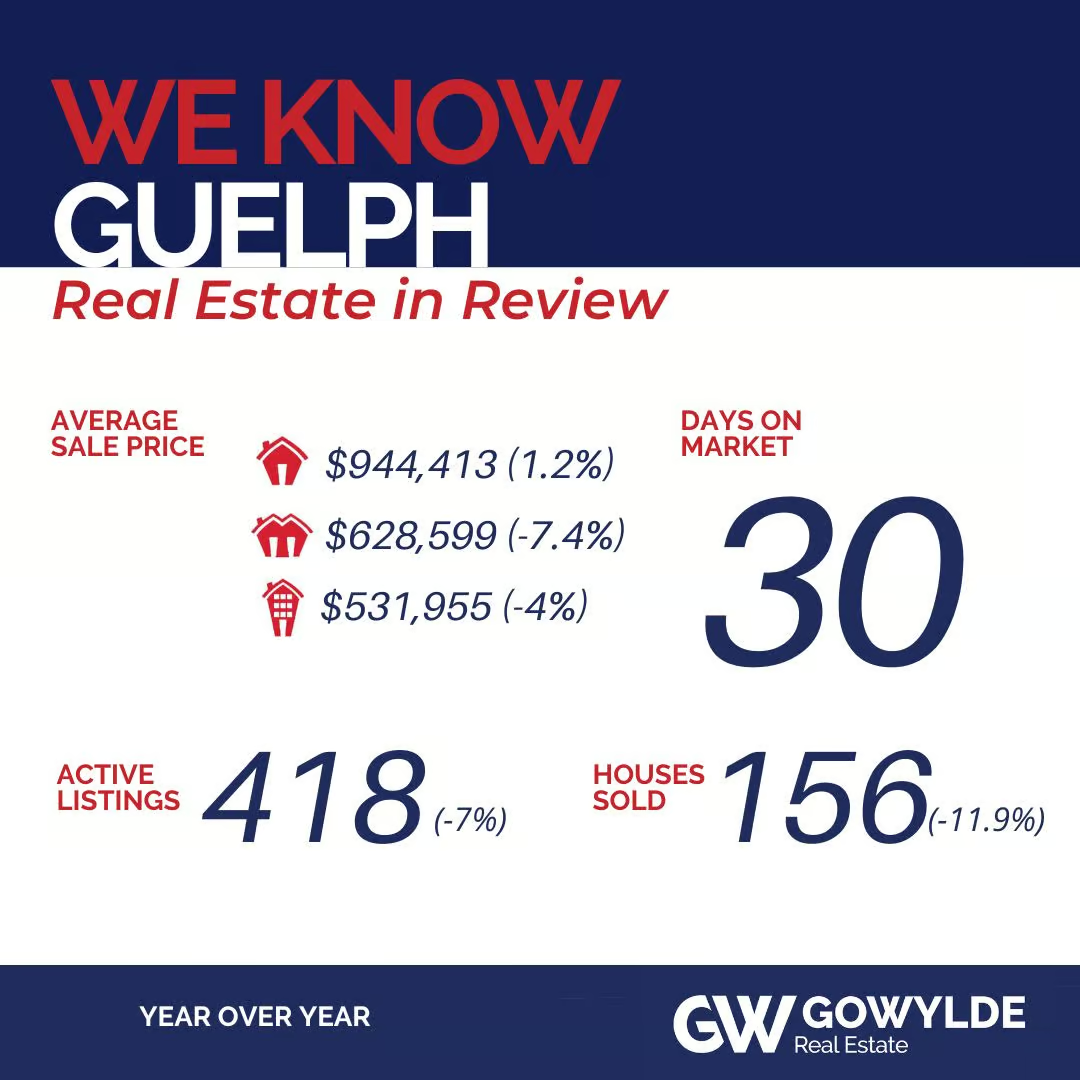
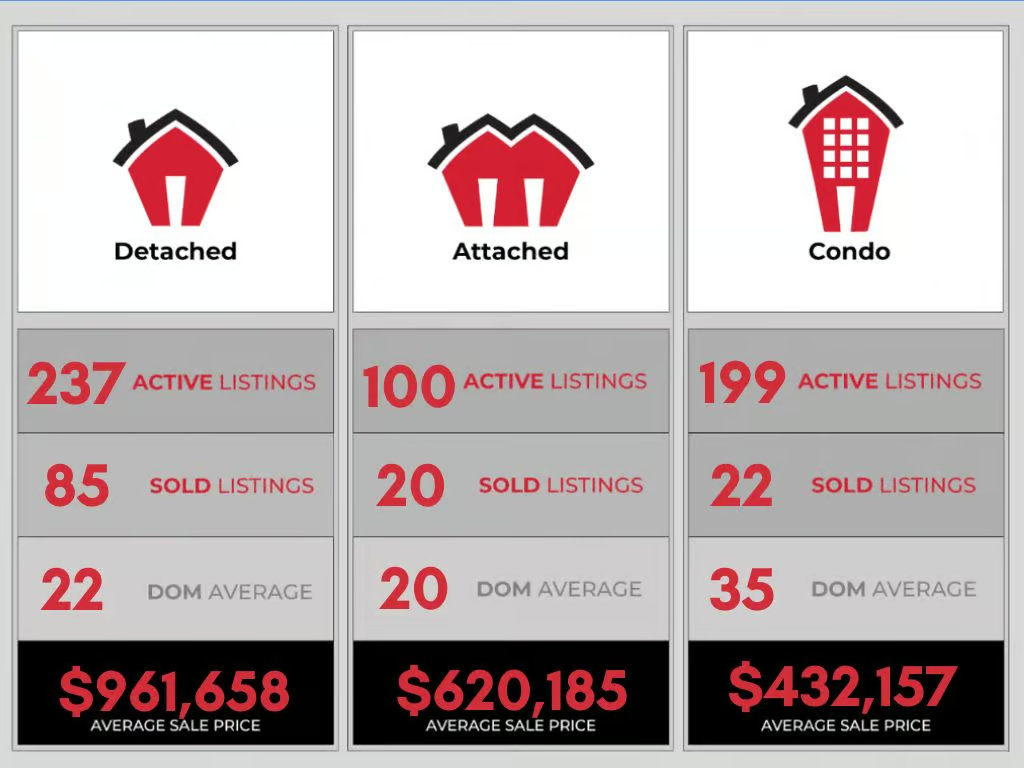
Guelph continues to show resilience, with sales & prices increasing from April. There were 156 homes sold, up 9.9% from April, but down from last year. The average price was $794,714, up 6.1% month-over-month.
The most interesting story is about detached homes. Sales are down almost 24% compared to last year, yet prices are actually up 1.2% year-over-year to $944,413. That tells me buyers are still willing to pay for quality detached homes when they’re priced correctly. Inventory is higher, but sellers haven’t had to drop prices too much.
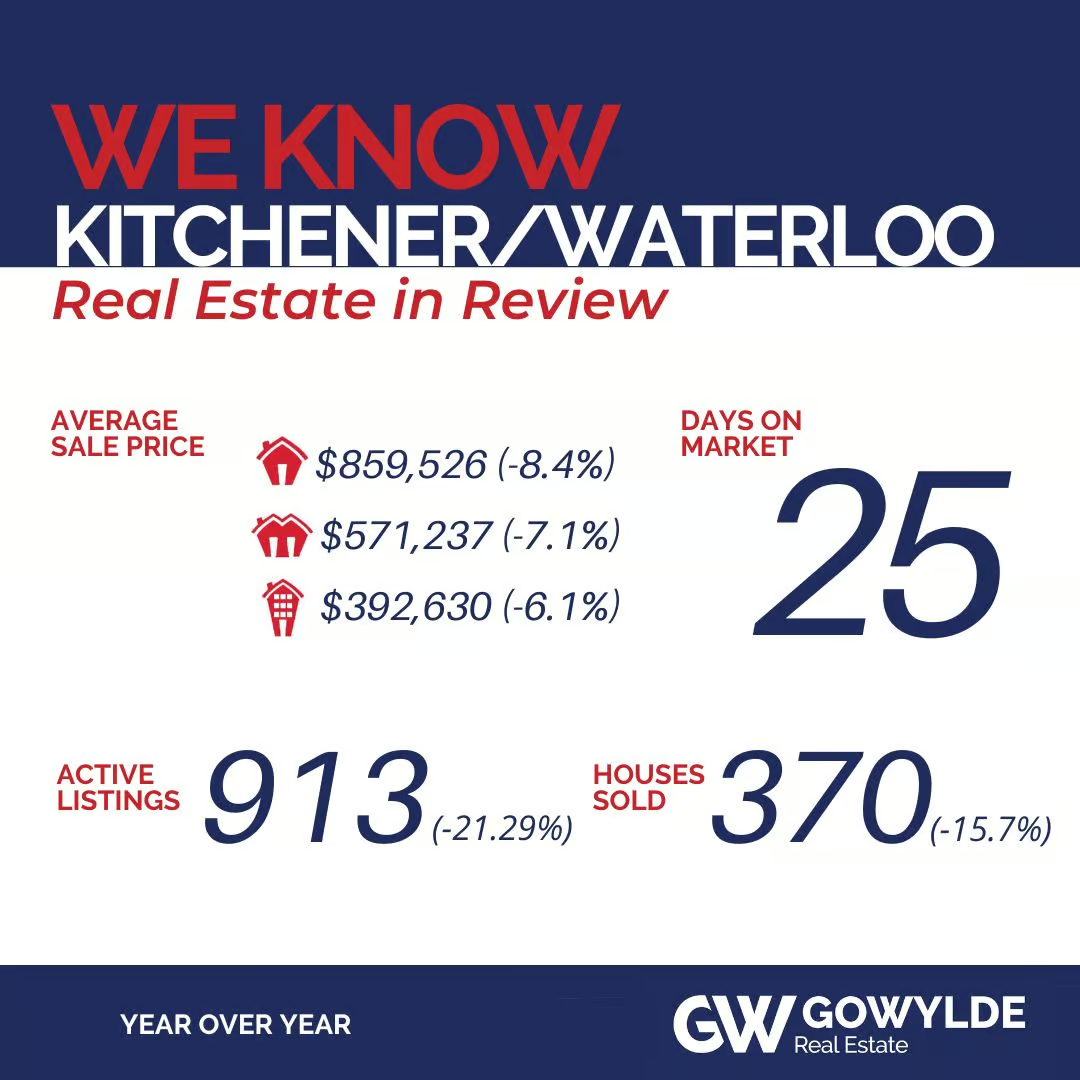
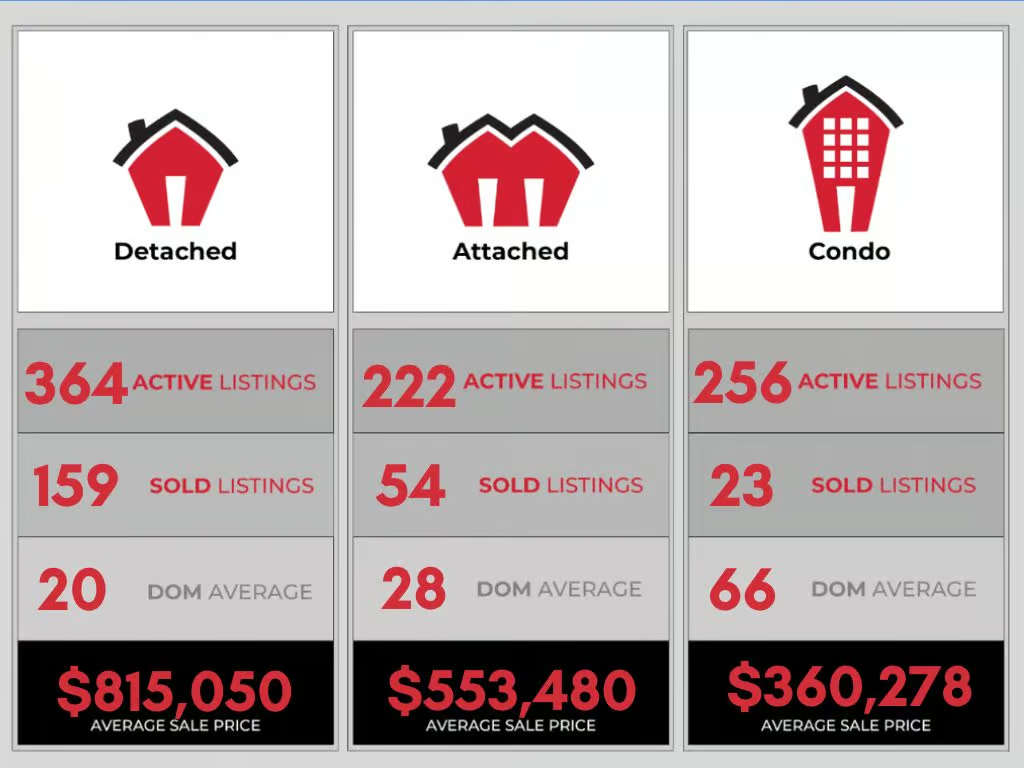
Kitchener/Waterloo remains the weakest of the Guelph/Tri-Cities markets, with significant year-over-year declines in sales and prices across almost every property type.
- There were 370 homes sold, up 7.3% from April but down 15.7% from last year.
- The average price was $737,729, down 5.6% year-over-year.
Kitchener/Waterloo has the largest condo market, but it is really struggling. Sales are down 25%, and prices are down 6%. This market accelerated the fastest and the furthest during the peak, but it is now showing the greatest correction.
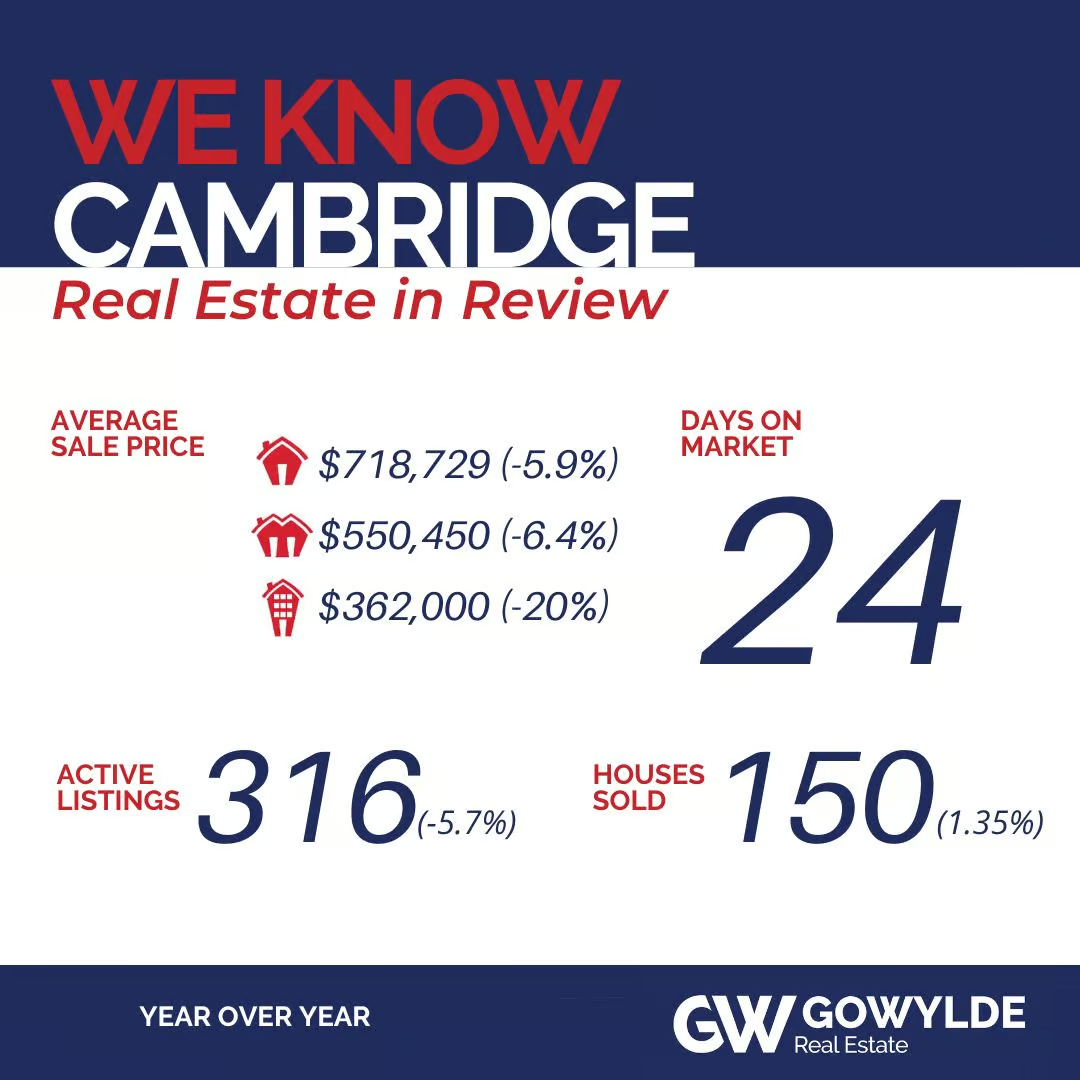
Cambridge may be the quiet success story of the month, with sales volume holding almost flat year-over-year despite a softer pricing environment.
There were 155 homes sold, essentially unchanged from April. Sales were down only 3.7% year-over-year. The average price was $670,222, down 11.1% year-over-year.
The condo market had a huge month, with sales jumping 133% from April, although that is based on a relatively small number of transactions. Prices have softened the most, but buyers are responding, keeping sales activity stronger than both Guelph and Kitchener/Waterloo.
Questions? Reach out directly!
Economic Update
The headlines have been all over the place lately. One week we’re talking about a recession, the next week Canada posts one of its strongest job reports in months.
So what’s actually happening? A technical recession simply means we’ve had two consecutive quarters of declining GDP. Historically, that’s been one definition of a recession. But the economy isn’t sending a completely clear signal right now.
In May, Canada added an unexpected 88,000 jobs, far above forecasts. Even more encouraging, those gains came entirely from full-time positions. At the same time, the unemployment rate improved from 6.9% to 6.6%.
Home sales remained slower than normal, but prices have been surprisingly resilient. While many economists had expected interest rate cuts earlier this spring, the Bank of Canada ultimately held rates steady following the latest jobs report.
The biggest takeaway is that we’re in a very fluid environment. Economic data has been changing quickly, and that’s causing forecasts to change quickly too.
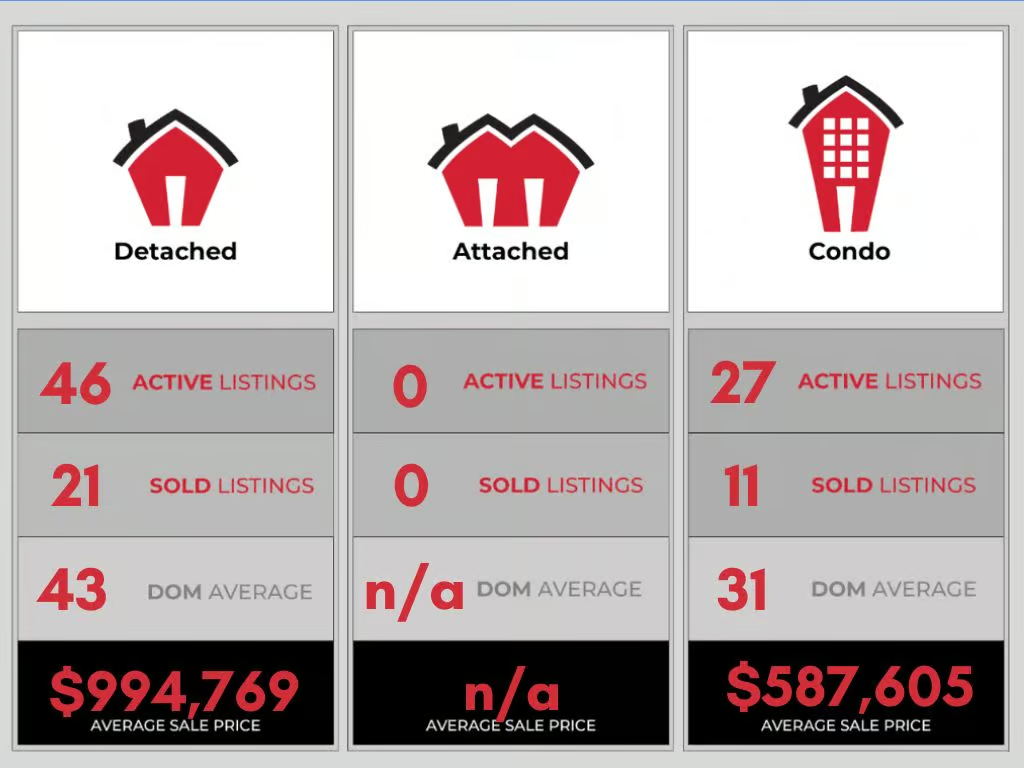
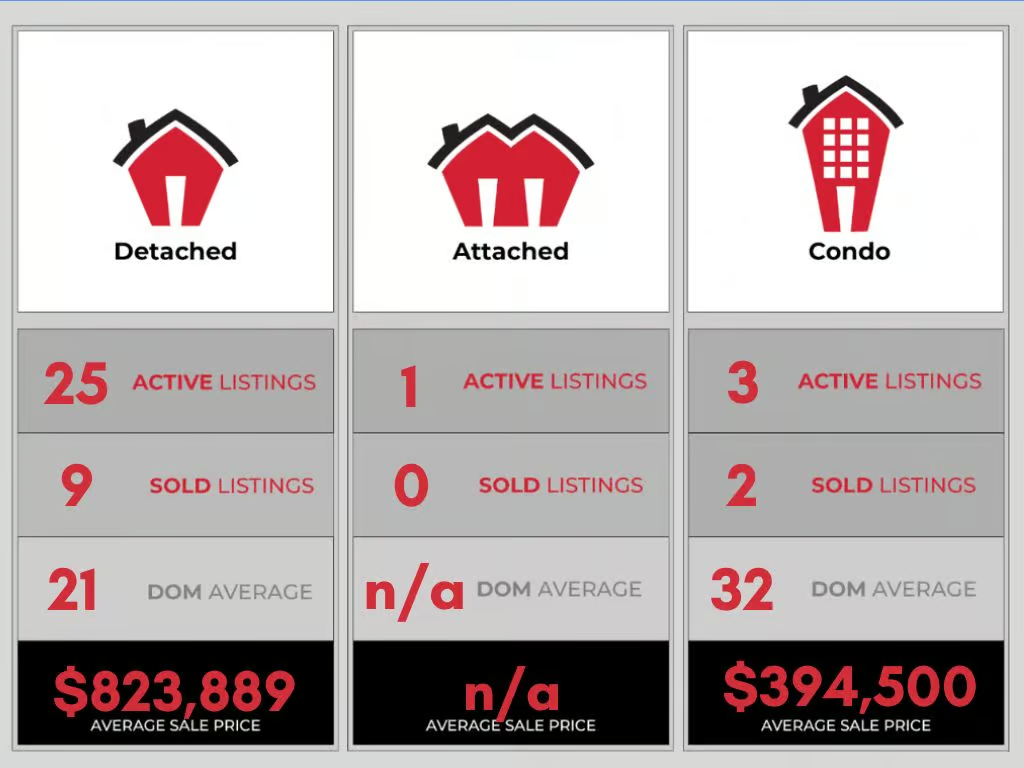
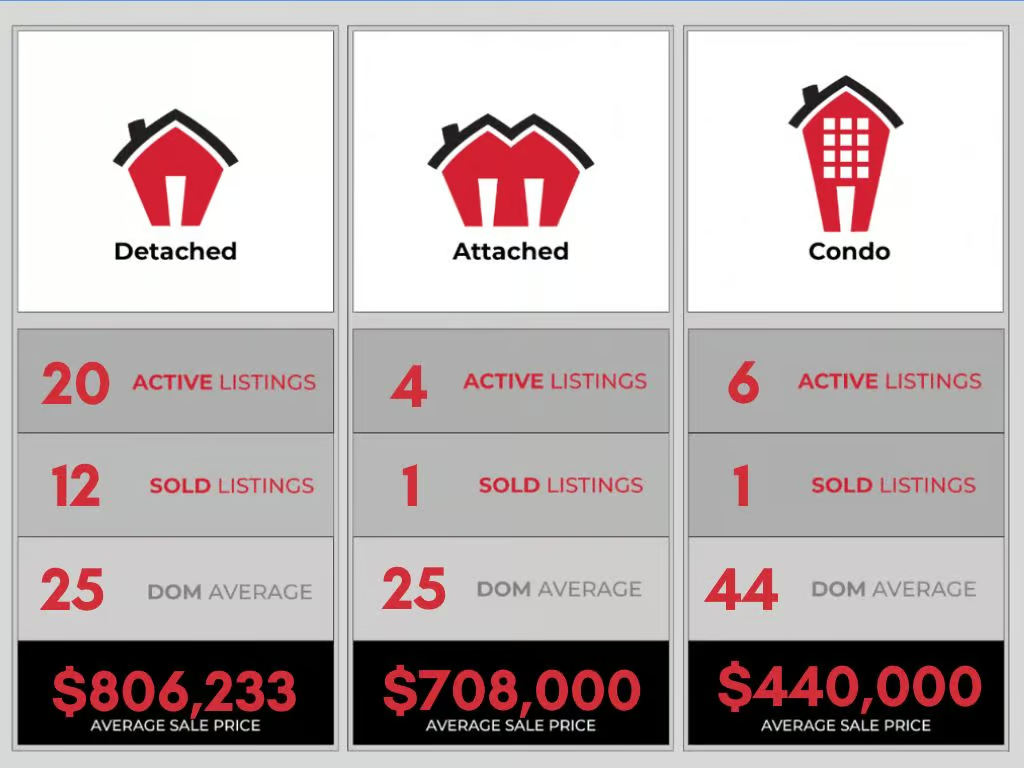
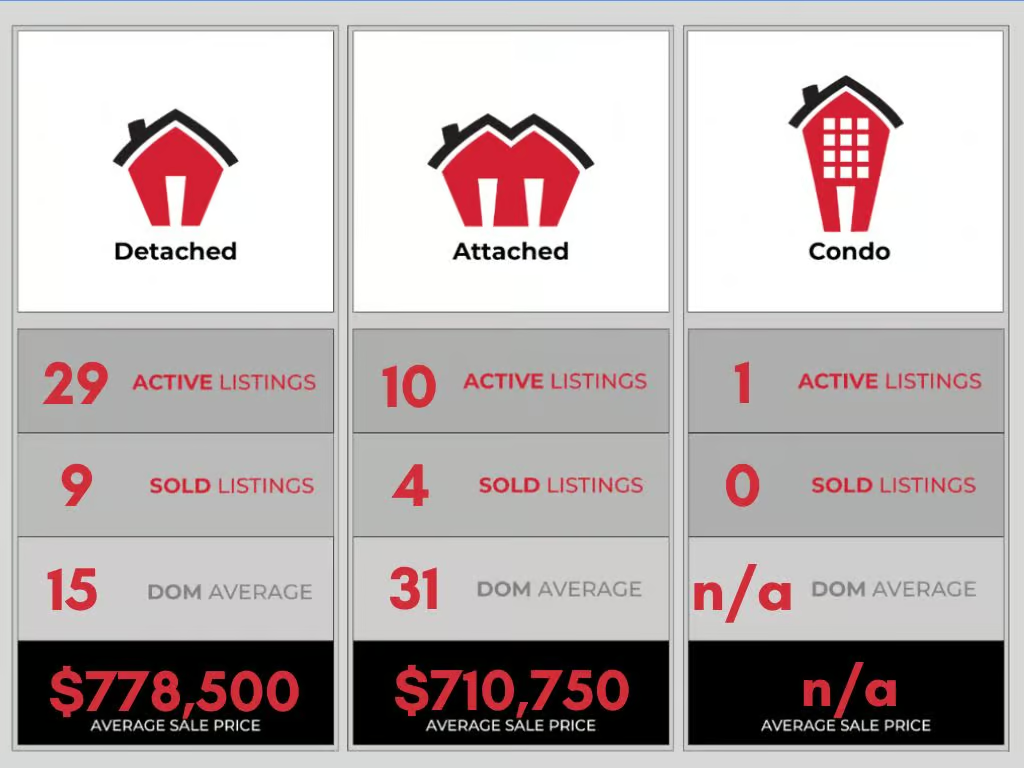
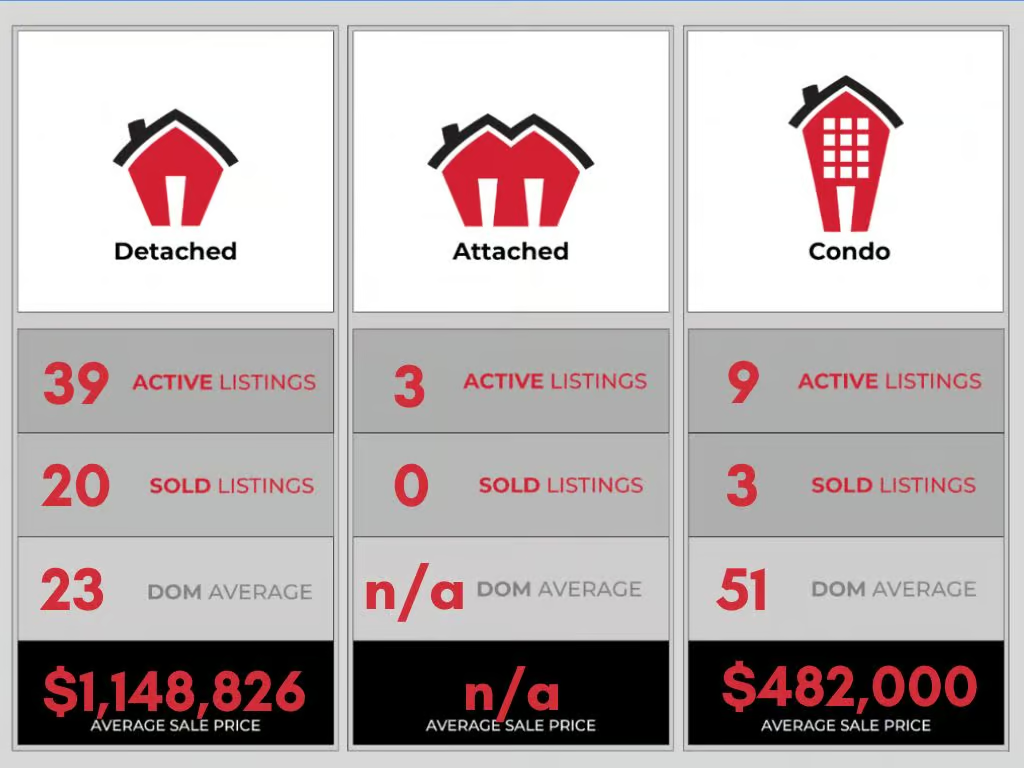
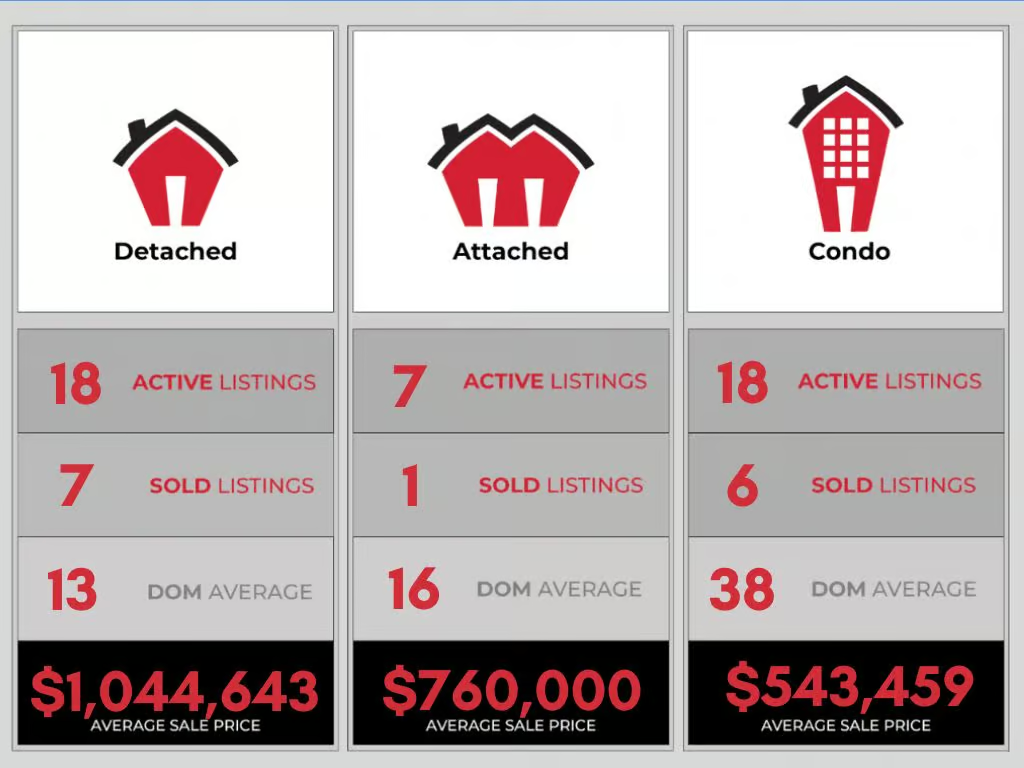
Guelph Neighbourhood Statistics

Click here for Active/Solds In This Area
Click here for Active/Solds In This Area
Click here for Active/Solds In This Area
Click here for Active/Solds In This Area
Click here for Active/Solds In This Area
Click here for Active/Solds In This Area
KW Neighbourhood Statistics

Click here for Sold Listings In Kitchener
Click here for Active Listings In Kitchener

Click here for Sold Listings In Waterloo
Click here for Active Listings In Waterloo
Cambridge Neighbourhood Statistics
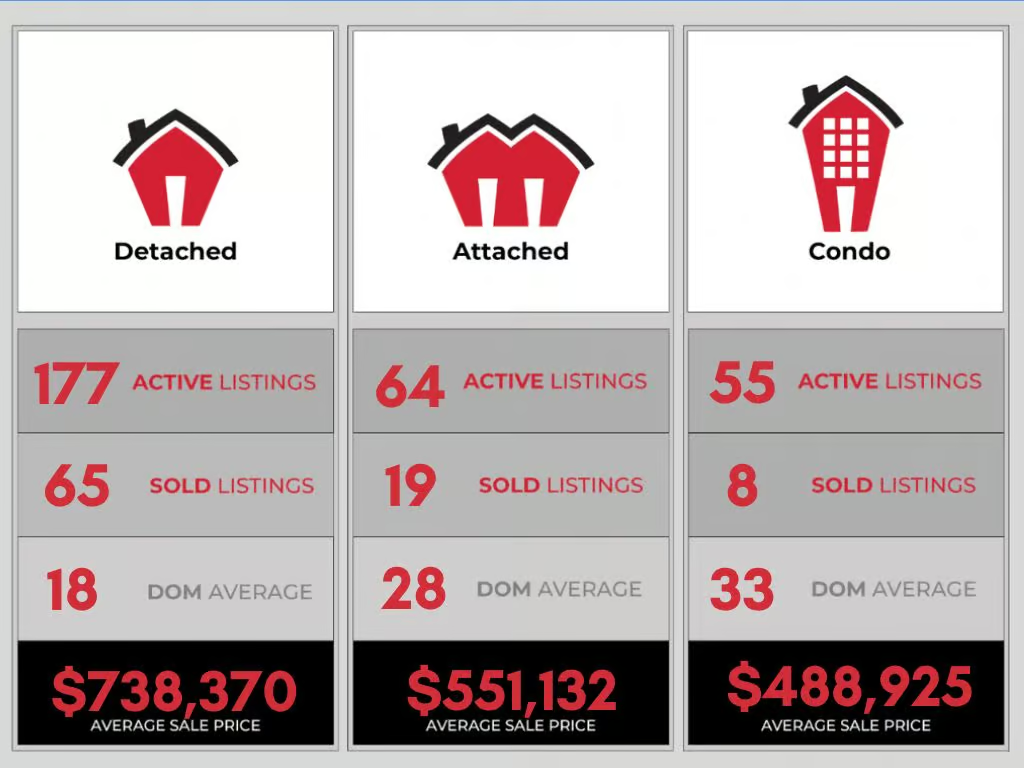
Click here for Active/Solds In This Area
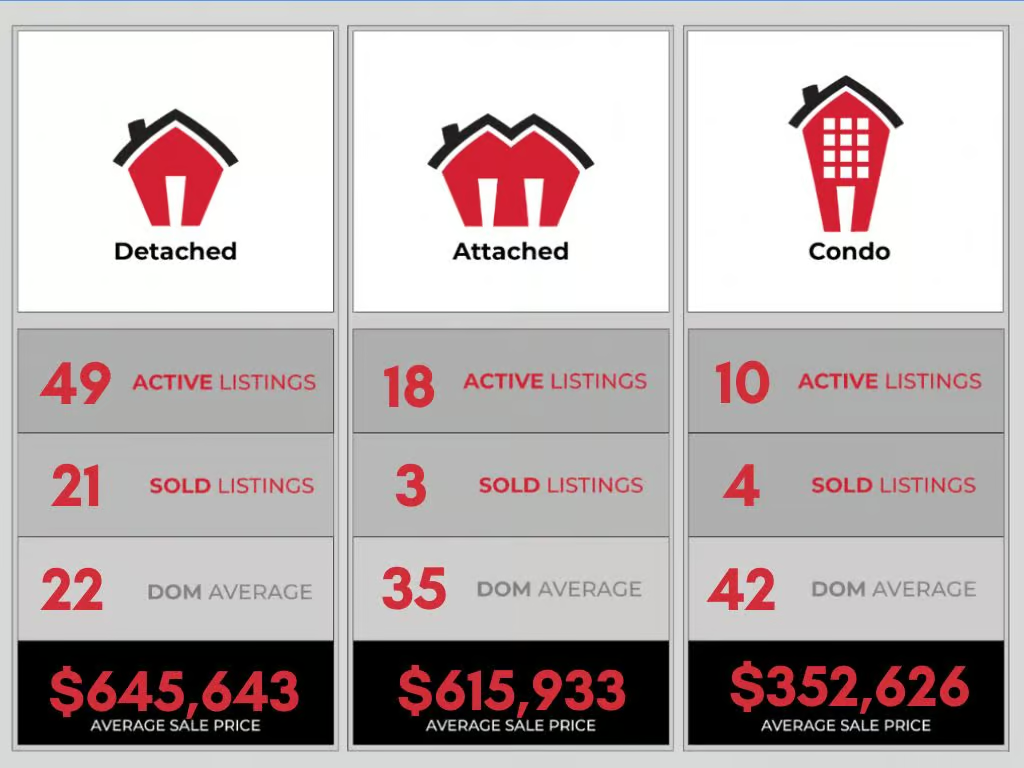
Click here for Active/Solds In This Area
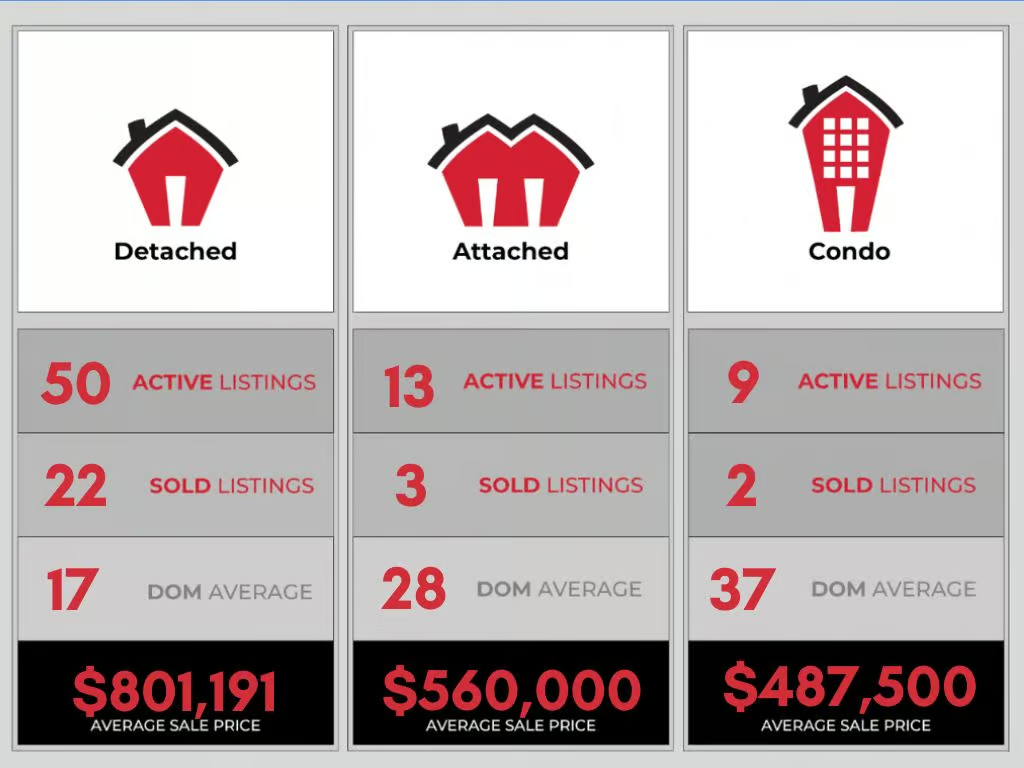
Click here for Active/Solds In This Area
Curious what your next move could look like? Reach out – we’d love to help.
Ready to plan your next step? The GoWylde Vault has the calculators, guides, and neighbourhood insights to help you make a smart, confident decision in 2026.